Definition: Formally, a graph G = (V,E) is a mathematical structure consisting of a set V of vertices and a set of E of edges, where elements of E are unordered pairs {u,v} of distinct vertices.
These are the following steps by which you can draw a graph in R easily
1st step: Install the igraph using the following code
install.packages("igraph")
2nd step: Import the igraph package
library(igraph)
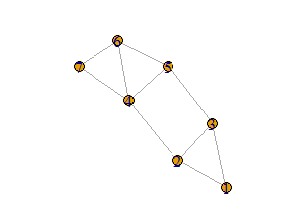
3rd step: Create a variable and assign graph.formula() object by the following way